New FHWA tool to enable cities to measure and ultimately reduce parking cruising
It has been stubbornly difficult for city officials to gain a good understanding of where, when, and why cruising for parking occurs. Often, based on anecdotal evidence, cities have conducted surveys of drivers and/or set up monitoring systems based, for example, on license plate recognition, to study cruising in places where they already believe parking to be a problem. Where a problem is identified, some cities have implemented performance pricing at the curb—raising the meter prices until an available space is almost ensured. Under this policy scenario. the thinking is that no one would have to look for parking but rather would only have to be willing to pay for it. The truth, however, turns out to be more complex.
Defining Cruising
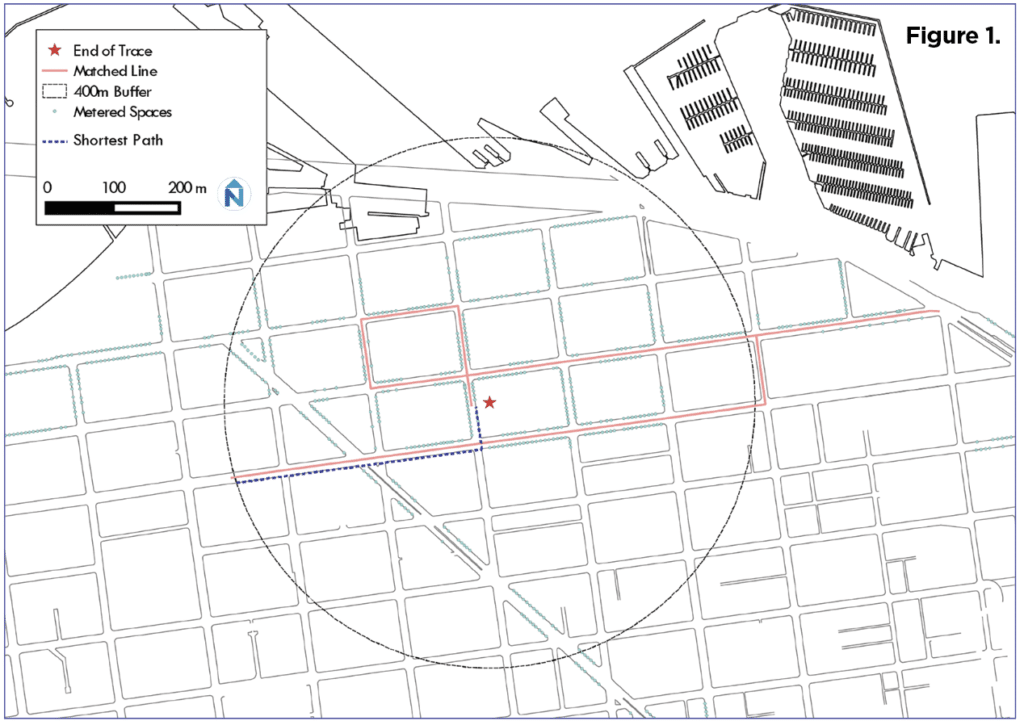
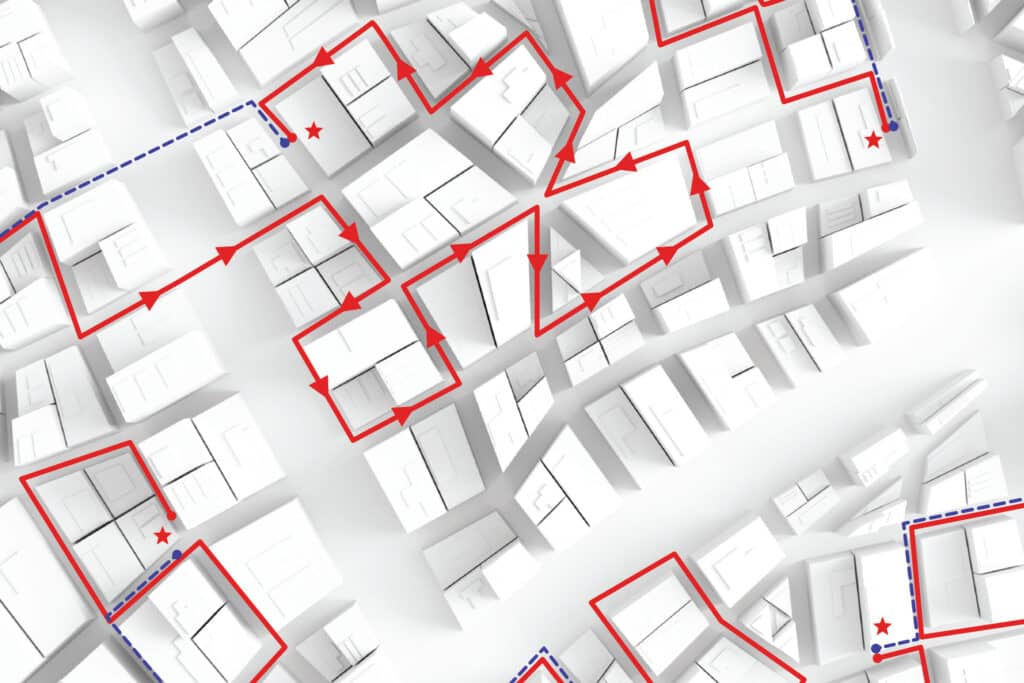
The first challenge is to define cruising. For this project we determined a trip to be cruising if the driver took an indirect path to their parking destination. In the following illustration we show an actual path and the most direct path a driver could have taken. Given the relative lengths of the direct path and the path taken, we assign this trip a high probability that the driver is searching for parking.
Finding the Reasons
The next challenge is that cruising is only sometimes caused by an overall lack of parking availability. Cruising in traffic often occurs for reasons unrelated to parking search, such as when ride-hail and taxi drivers are seeking their next fare. Thus, when evaluating parking-related solutions, cruising for non-parking reasons needs to first be identified, and later studied and understood separately from parking related cruising. Parking-related cruising may occur for any number of reasons, including if available parking isn’t of the desired “flavor.” For example, if the regulation of a particular spot includes a time limit (meters often do) and the person wanting to park needs a space for longer than allowed, then that availability is not useful to that driver. Alternatively, if some parking is free and other parking isn’t, some drivers will bypass paid parking and cruise in the hopes of finding free parking.

Research by the authors of this article has shown that frequently (about 50 percent of the time in a San Francisco study) a driver searching for parking is looking for the “right kind of parking.” We showed that in about half of the cases, a driver identified as looking for parking would bypass an available meter and continue their search. Other research by this group has shown that parking scarcity—real or perceived—could lead to drivers taking a spot ahead of their destination, thereby, resulting in less driving.
In our research in Seattle, meanwhile, a recent meter price hike, though intended to enhance availability and decrease cruising, was followed by an increase in cruising trips that ended on a metered block. Higher meter prices likely made free parking on the surrounding unmetered blocks much more coveted and harder to find, thus while leading more drivers to cruise for free parking also led to more failure (meaning that drivers go back to parking at the meters). After the meter increase, we also observed cruising trips of reduced duration on average. The combination of more cruising but of shorter duration suggests that more drivers decided to look for free parking but quickly resigned themselves to paying the meter. Not surprising, having any nearby free parking was shown to tempt drivers to cruise to avoid paying. If localities see this as a problem, they could choose to make adjacent streets unavailable to parkers through regulation or by introducing new meters.
The second challenge is that cities still lack a good initial understanding of the severity of the cruising problem and the geographic hot spots and times of day when cruising is most prevalent. Cruising has often been estimated by a variety of techniques including stopping and asking drivers, or by observing how many vehicles bypass an available space and using the rate at which the spot is taken as an estimate for how many vehicle drivers are looking for parking (e.g., if, on average, three drivers by-pass a space before a driver takes it, that would mean that one-quarter or 25 percent of drivers are searching for parking). Another strategy has been to have field researchers actually look for parking in a neighborhood thought to be problematic –whether dispatched in cars or on bicycles these researchers are given instructions to circle until they find an available space. They keep track of how many blocks they traverse until finding a space. A third technique is to detect the number of cars that pass the same point repeatedly within a certain period of time.
The Shape of Cruising
Each of these methods is imperfect. One drawback is that most people looking for parking are not doing so in a circular pattern. In the article “The Shape of Cruising,” it was shown that very few drivers actually “circle” in their hunt for parking. Rather, circling is but one of multiple search strategies, and the predominant search strategy may vary by local custom and/or factors related to traffic or parking rules. Another challenge is that most cities lack the resources to quantify cruising across every neighborhood. Thus, they look for cruising where they most expect to find it, and, thus, are likely to overestimate the overall extent of the problem. After all, University of California Professor Donald Shoup’s finding that, where studied, an average of 30 percent of cars in congested downtown traffic in selected cities were cruising is frequently misrepresented as 30 percent of urban traffic, or even 30 percent of ALL traffic is cruising.

What About the Neighborhood?
Attempting to understand cruising is complicated by the fact that the proportion of traffic looking for parking is highly dependent on the characteristic of the area as the destination or as a place that is being passed through on the way to another destination. One study in New York City found that among “residents of a neighborhood,” some 65 percent of people driving said they were looking for parking. When surveying motorists at or very close to their destinations, and deliberately excluding pass-through drivers from the survey, it is likely that a very high proportion of those surveyed will be “looking for parking” even if not cruising (e.g., motorists keeping an eye out for an available space prior to reaching the destination are not cruising). At the extreme, in a parking lot, every car driver is either looking for parking or on their way out.
In other words, a high proportion of people searching for parking says as much about the characteristics of a neighborhood as it does about any excess traffic from parking search. There is a subtle distinction between searching for parking—involved in almost any trip that does not end in a reserved space—and cruising for parking—excess -vehicle travel, with its negative consequences for congestion and pollution.
Professor Donald Shoup has characterized parking search as waiting in a queue of undetermined length and expecting your turn to be called at random. The confounders we discussed above support this characterization.
The problem is to identify excess driving due to parking search, as that is what contributes to increased pollution, greenhouse gas emissions, traffic, crash risk, and aggravation on the drivers’ part, which implies a degraded quality of life. And, further, there is a need to develop robust policy and infrastructure solutions that might mitigate excess parking search but also will not encourage excess driving unrelated to parking search.
To advance these objectives, and as alluded to earlier, some of the authors, in previous work, developed a system of characterizing trips as likely cruising or likely not cruising according to circuity observed in GPS traces that show a driver’s path. While looking at all trips across an urban area is infeasible, studying a sample of trips allows the identification of the areas, across any geography, where excess driving due to parking search occurs with some regularity. Depending on data availability, cruising in cities at any geography and over any time period can be understood; thus, allowing the development of strategic, targeted interventions.
FHWA’s Cruising Assessment Tool and Its Applications
The Federal Highway Administration (FHWA) is in the process of completing its development of a cruising detection and measurement system which will be shared with IPMI, cities, and the public at large. The research team used multiple data sources including GPS traces that are collected by a data broker from navigation devices, statewide travel surveys that included GPS sample components, and data that were collected in connection with safety studies wherein the vehicles of volunteers were instrumented with GPS trackers.
The team is now in the process of testing the system with location data collected from a variety of cellphone apps that identify the phone’s geographic location throughout the day. Thus far, the team has found significant differences in data quality, ranging from instrumented travel surveys/safety studies which have been the best, navigation devices which have provided data of somewhere in between quality relative to other data sources, and generic app location data which has been the least reliable. The purpose in using all the different sources in development is ultimately to determine, through systematic comparison among data sources, if the lowest quality data–that which is most widely available—can be sufficient for municipalities to identify and understand their parking problems.
By tracking the same data sources before, during, and after major occurrences (e.g., COVID lockdowns or large stadium events) and parking policy changes, FHWA has been able to assess impacts. As part of the current FHWA study and in previous work, to date, the team has looked at San Francisco, Ann Arbor, Seattle, and Washington, D.C. and, in each case, identified a particular difference in pricing or urban configuration. In San Francisco, we looked at the city generally and specifically in the SFPark meter areas. In Seattle, we looked before and after a programmed meter price change. We also looked in Seattle during the COVID-19 pandemic before and after the meters were suspended. They were turned off in April 2020 in recognition of the low demand for on-street parking in metered districts and as a way to accommodate essential workers. In Washington, D.C., we looked at cruising around stadiums on event and non-event days and at different patterns of parking search in Metrorail station catchment areas and outside of those areas.
Findings

The top line finding is that cities have likely overestimated their parking search problem by abstracting from the areas known anecdotally to be the worst. In spite of the myth that 30 percent of traffic is circling for parking, we find that the percentage of trips that include excess parking search is between 5 percent in Ann Arbor and 7 percent in Seattle. These lower rates don’t mean that cruising isn’t a problem, but rather is less universally one than previously thought. That’s good because it also means that cruising is likely more solvable through targeted measures. Solving cruising is a nuanced undertaking, though, and application of the measurement methodology over time will provide more insights on that subject.
San Francisco
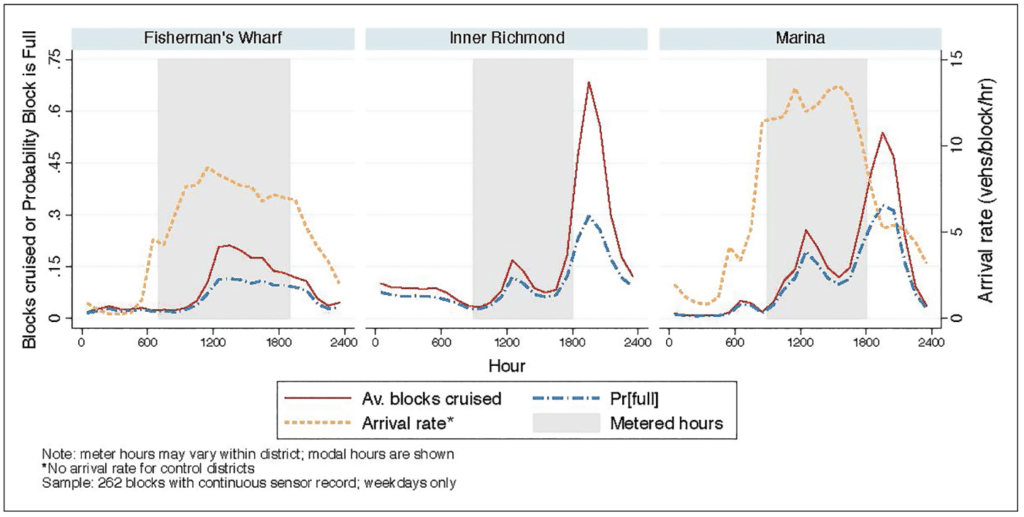
We found that cruising for parking in San Francisco occurred in tourist destinations more than in the downtown where it might have been expected. The most instructive finding from San Francisco was that cruising increased dramatically in some metered areas the minute meters were turned off for the day (see illustration). The importance of this finding for cities generally is that meter hours of operation could be tailored carefully to match the adjacent land uses. Rather than shutting meters at times when demand is thought to decrease, leaving them operational but charging lower rates may be a better strategy. Similarly, in a restaurant or evening entertainment district, data on cruising may show a spike if meters are turned off at the end of conventional business hours, which would be averted if meter hours were extended.
Seattle
Overall approximately 7 percent of trips in Seattle include a cruising component, and the average time spent cruising was just over one minute. Trips that end on metered blocks have a cruise rate of 9.6 percent, reflecting denser busier parts of the city, and the average time cruising is 2 minutes. While cruising trips are relatively concentrated in the downtown, the amount of time people spend looking for parking is fairly uniform across the city.
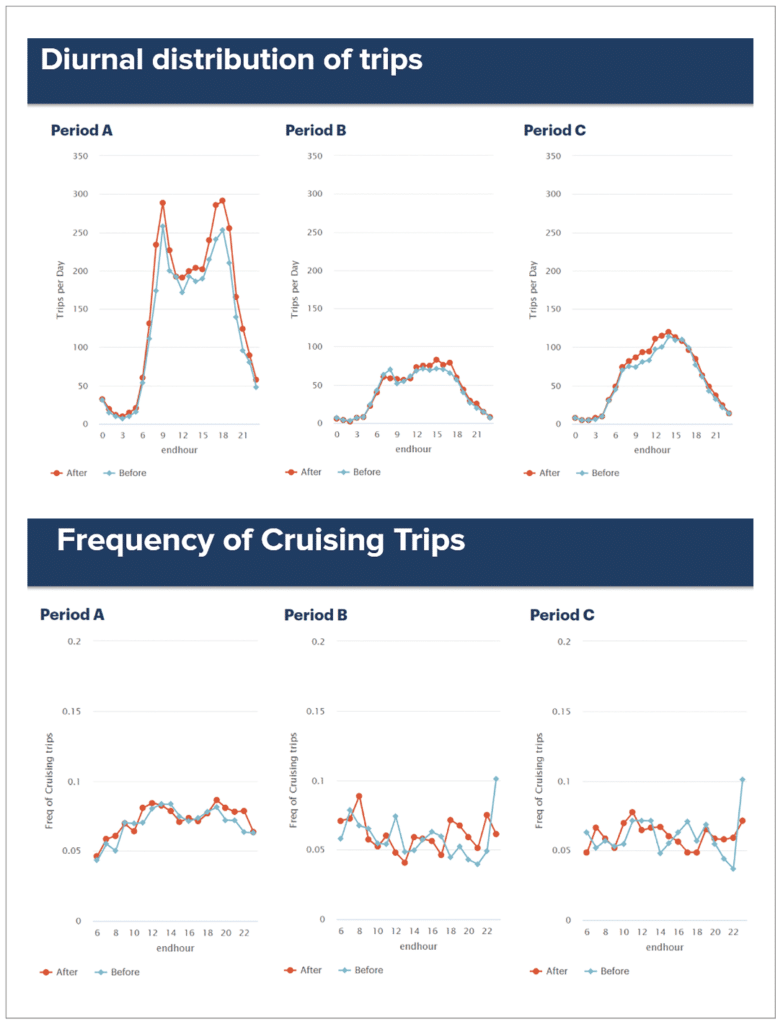
Seattle’s Department of Transportation (SDOT) annually adjusts meter rates (up or down) to meet established performance targets. Changing meter prices has potentially opposing impacts on cruising. First, a higher price discourages people from “consuming more parking than they need.” This is the critical principle underlying performance pricing. By discouraging parkers from staying too long, parking spaces are made more available. This is the way that performance pricing works. The price is set to ensure availability. At the same time, a higher price incentivizes some drivers to look harder for a bargain, so while parking spaces are available, some drivers will cruise more if there is nearby free parking. Indeed, this is what we saw when studying parking search behavior immediately before and immediately after a routine price change. We see an increase in trips that involve cruising ending on metered blocks in areas where the meter price was increased – i.e. there was both more availability and more cruising at least as the drivers settled into the new price patterns.
In all three conditions—when meter price increased, decreased, or stayed the same—we saw a decrease in the amount of time spent cruising. As Seattle’s price changes (whether up or down) are based on block demand, adjustments designed to balance demand to better match supply should lead to overall reductions in cruising, although there is no obvious explanation as to why cruising would go down when prices went down or stayed the same (except, perhaps, if sometimes-higher prices were widely publicized and led to fewer driving trips, especially to blocks with high-priced meters, and less competition for parking throughout the neighborhoods).
Finally, in Seattle, we looked at the time periods immediately before and immediately after the meters were suspended as part of the City’s COVID-19 response. While trip-making was dramatically different in the early months of COVID, with about 1/3 the number of trips being made, the proportion of trips that were cruising remained constant.
Washington, D.C.
Similar to Seattle, the proportion of trips that involve cruising across the city is relatively low at 6 percent (versus 7 percent in Seattle); in D.C., the average amount of time spent cruising is higher at almost two minutes (versus one minute in Seattle). With no price changes to examine, we examined cruising around stadiums and in Metrorail station areas and compared that with the rest of the city. Cruising is notably higher on weekends when travelers face the double impact of reduced transit service and abbreviated meter hours.
On event days, cruising around the stadiums was 50 percent higher than the citywide average and cruising was worst around Audi field which is the furthest from transit of the three stadiums.
We also found cruising to be more prevalent around the Metrorail stations—those areas represent the densest parts of the city—than elsewhere.
We are currently analyzing two other cities: Atlanta and Chicago. The Atlanta analysis will be cross-sectional and show different patterns of parking search across the city. The Chicago analysis will be longitudinal and show annual changes in cruising from 2018 through 2020.
We are also taking a second look at Seattle using a lower quality but more available dataset. Our expectation and goal is to create a tool that any city can use with the most readily available data so they can study their own parking search landscape in the most robust way currently possible.
Conclusions
We have reviewed research about misconceptions related to parking cruising, the benefit of focusing on cruising instead of space availability as a performance metric (due to restrictions on some vacant spaces precluding various parking uses), and the need to distinguish cruising for parking versus for other purposes. We have shown a comprehensive way to identify parking cruising, along with the viability of using the tool to understand the geography and time of day/day of week of cruising. The tool is robust to available data. While experience is thus far limited, the tool is already beginning to show value in guiding the evaluation of an array of parking policy approaches and regulations and steering policy improvements toward better outcomes.
The tool should enable cities with a staff that includes a parking professional and a GIS specialist to tell their own parking cruising story. Then, by closely analyzing the data and contemplating lessons from elsewhere, the tool will help direct efforts to mitigate identified cruising problems.
How will you use it? ◆
Experts say 30 percent of urban traffic comes from cars circling in the hunt for parking—but recent research says that’s not necessarily true. Join experts from the U.S. Federal Highway Administration during an IPMI Webinar Thursday, Feb. 17, to learn why that number is usually much lower and how they’ve developed a new tool to reduce circling even more, potentially transforming the way people find parking and how professionals manage it. Bring your questions and thoughts on this article and get ready for a deeper dive: click here for details and to register.


